Friday, July 4, 2008

Tables in MATLAB with uitable


I’d like to welcome guest blogger Denis Hanson from the GUI Building team. Denis will occasionally be blogging here on the Inside the MATLAB Desktop blog.

In R2008a, we added the uitable control, as well as support for this new control in Guide. The uitable component enables the display of data in a two dimensional table. You can use the Property Inspector or the new Table Property Editor to get and set uitable object property values (to open the Property Inspector type inspect at the command prompt; to open the Table Property Editor, right-click your uitable in Guide and select Table Property Editor…).

The Table Property Editor makes it easy to define the layout of a table inside Guide. The Property Inspector could be used to achieve the same results, though it’s not targeted to uitable. Lets look at using the Table Property Editor to setup a uitable.

Table properties fall into four natural categories, which are presented on separate panels. Here’s a listing of each of the Table Property Editor’s panels, and what you can do on each:

  • Columns – set column names, format, size, and editability
  • Rows – set row names
  • Data – select data to display in the table
  • Colors – set colors and control row striping

Notice also that at the top of each panel is a help section. The text in the panel will change to reflect the option that is currently selected on the property panel.

Let’s look at each of the panels in detail.

Columns Panel

The Column Headers section of this panel lets you control how and if column headers are displayed. The Column Definitions section of this panel lets you tweak properties for each column and also allows the insertion, removal and rearranging of columns.

The Format column in the Column Definitions table specifies how the data should be formated for viewing. Here are each of the options and what they do:

  • Let MATLAB Choose - MATLAB chooses a format that most closely matches the underlying column data. For example, if the data in the column is doubles, the Numeric display option will be used.
  • Choice List - allows you to enter a series of series of values that will be displayed in a popupmenu. This option is especially useful if the column is editable and you want to restrict the values that they user can enter.
  • Format - lets you choose from a pre-defined list of formats for displaying numeric data. The options are the same as those found in the format function.

Rows Panel

The Rows panel lets you define how row headers are displayed. Row headers are shown in an additional column at the left edge of the table. They do not contain table data values. If shown, they typically display the row number, but you can enter a custom name for each row.

Data Panel

The Data panel lets you populate the table with data from workspace variables. A table row will be created for each row in your data set and a table column will be created for each column in your data set. Once you have saved the data into the table, the table contains a copy of the data. The table data is not linked to the workspace variable so further modifications to the workspace variable will not be reflected in the table.

The values you set here are used to populate the table when your figure is displayed. This is useful if you have canned data that does not change. If your data is not fixed, you should select the Do not set data value and leave the table empty option. You will then need to load table data programmatically.

Colors Panel

The Colors panel lets you define the background, foreground, and row-striping colors used to paint the cells in the table. When row-striping is on the table paints odd and even rows using different background colors. The striping effect makes it easier for a user to scan the data in a table row, especially if there are many rows of data.

This was a world-wind tour of the new uitable control - in a future post, we’ll show you how to use the new control in a real application.

Let us know what you think about uitable!

Tools on the Side

About a year ago Ken Orr discussed the docked “maximize” feature that was introduced in R2007a (Focusing on your work). He explained how you can use this feature to temporarily expand a particular tool (sub-window) to fill the entire MATLAB window. Also introduced in R2007a was a docked “minimize” feature. Docked minimize and maximize have similar intent, allowing you to optimize your use of screen real-estate.

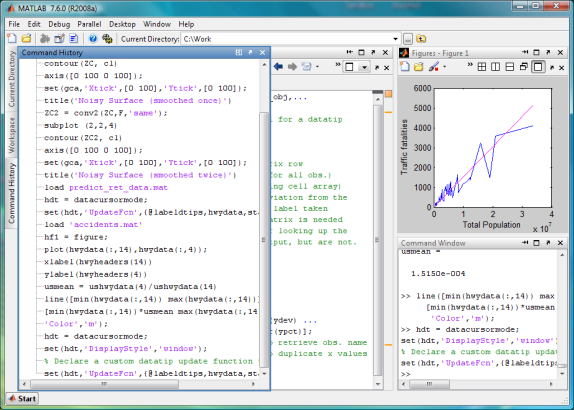
Here’s a scenario where I find docked minimize useful. I’m tweaking an M-File that generates a figure. I want to see the M-File and figure side-by-side so I dock both and arrange my MATLAB desktop as shown:

Cluttered MATLAB

This facilitates my workflow reasonably well but it’s a bit cluttered and I’d really like my Editor to be wide enough to display the longer lines of M-Code. I could close the Current Directory, Workspace and Command History tools to recoup some real-estate. However, while they may not be central to the task at hand I do find occasional use for these. Instead of closing these tools I can minimize them by clicking on the small left-pointing arrows on their title bars.

Minimize Button

As I minimize each tool it is hidden and a corresponding button appears along the left border of the MATLAB window. I’ll refer to the row of buttons along the border as a “sidebar”. The documentation doesn’t use this term but doing so here is consistent with the title of “Desktop Bar Tender” to which I laid claim in my last post. With the Current Directory, Workspace and Command History all minimized to the left sidebar, my MATLAB desktop looks like this:

Improved Layout

When I want to access one of the minimized tools I either hover over its button to reveal it without giving it focus or click its button to both reveal it and give it focus. For example if I click the Command History button, the Command History appears overlapping the left portion of the Editor like this:

History Revealed

After I’ve gotten what I want from the Command History I hide it by clicking its button again or clicking on some other tool such as the Editor. If I find myself using the Command History so frequently that I want to return it to my layout I can either double click its sidebar button or click the “restore” icon on its title bar.

Restore Button

If you’ve found this feature useful in your work or if you’ve identified shortcomings that make it less useful than it could be, I’d love to hear from you.

Model-Based Design in the MATLAB Desktop

In honor of our newest blog, Seth on Simulink, I’m dedicating this week to some useful features for Model Based Design in the MATLAB desktop.

The following is a survey of the various tools that come with MATLAB (available to everybody, depending on release), and how they can be used in a Simulink-based workflow. I’ve broken up the tools into two categories: those used for model setup, and those used for data analysis.

Tools for setting up/running your model include the MATLAB Editor, the EML Editor, Path Tool, and the File and Directory Comparisons.

The MATLAB Editor
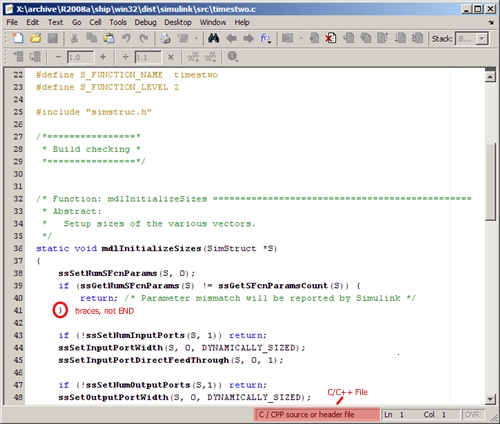
If you’ve been following this blog for awhile, you might know that the MATLAB editor understands C and TLC files, provides indenting, as well as brace-matching and syntax highlighting for these languages. This allows you to write or edit S-Functions and TLC scripts without having to switch out of MATLAB.


MATLAB Editor

The MATLAB Editor is also useful for writing model callbacks (I find it easier to debug whole M-files instead of trying to squeeze complicated code into the little box in the block properties). And of course, it’s great for writing test programs, sl_customization.m files, and data analysis scripts.


The Embedded MATLAB (EML) Editor

The EML editor (opened when by double-clicking an EML block) is built on top of the regular MATLAB editor, providing all the nice M-file features, plus information related to the execution and building of a Simulink model. In particular it has toolbars for configuring the data ports and building the model.


EML Editor


The Path Tool

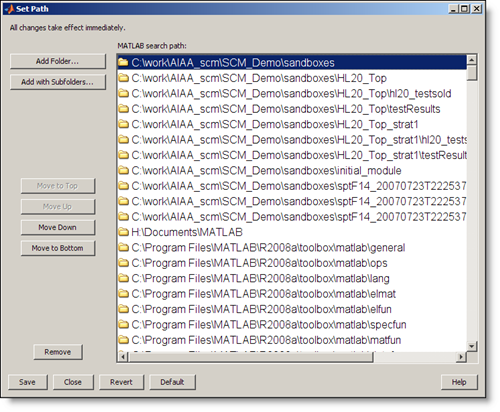
The pathtool (File -> Set Path…) is a GUI for managing your MATLAB path. My Simulink projects tend to have a more complicated directory structure than my MATLAB projects. This is usually due to managing several libraries in addition to my model, its callbacks, and all my test and model advisor files. I find this GUI helpful for moving directories up and down the path, as well as making sure I have everything I need.


Path Tool


Shortcuts

MATLAB shortcuts on the main toolbar are useful to do each of the following addpath related tasks: set up your library, load common parameter values into the workspace, move generated code, or launch external utilities with the system command. We’ve even provided you with the Simulink icon to mark such shortcuts.

Shortcuts


Those were some of the tools available for creating models - the following three items are tools for analyzing the results of running a model or the results of generating code from Real-Time Workshop.


File and Directory Comparisons

The comparison tool is great for looking at differences between runs of rapid simulations (RSIM). Outputs of these simulations (either output blocks, logged signals, or To File blocks) are saved as MAT files between runs and can be compared using the comparison tool (updated in R2008a, to support comparing MAT files without having to load them into the workspace).

You can also use the tool to compare generated code files. Want to quickly see how the generated code changes if you tweak a subsystem option, or data type? Generate the code, change, and regenerate into a new location (be sure to just generate and not generate and build–you still get the code, but it takes longer). In fact, the R2008a version of the tool lets you start off by comparing directories and then drilling down into individual files.


F&D Comparisons
A comparison of sf_engine.c after changing the Engine subsystem of the sf_car demo to a reusable function.


Time Series Tool

The Time Series Tool (tstool) is useful for plotting, and manipulating time-series data, such as those generated by signal logging. This GUI provides actions for quickly plotting and filtering statistical information. In the following screen shot, I’ve logged the x1 and x2 signals of the vdp demo model and loaded them into the timeseries tool after running the model with the command: tstool(logsout).


Time Series Tool


Variable Editor

The variable editor is useful for editing complicated arrays of data, such as filter coefficients, look-up table data, or index selectors.


Variable Editor

Making full use of Simulink requires generating MATLAB code and data, which you can interact with using your favorite Desktop tools. Let us know what else you think is handy for model-based design in MATLAB

Profiling using run configurations

We talk a lot about work flows here on the Inside the MATLAB Desktop blog, as well as ways you can streamline your interactions with MATLAB. For the Editor-centric folks in the audience, here’s a great way to integrate Profiling into your workflow using run configurations.

Profiling run configurations will let you tweak the performance of your code more iteratively. You’ll be able to work from the Editor, press the run button, inspect the performance, and then go right back to your code to tweak it.

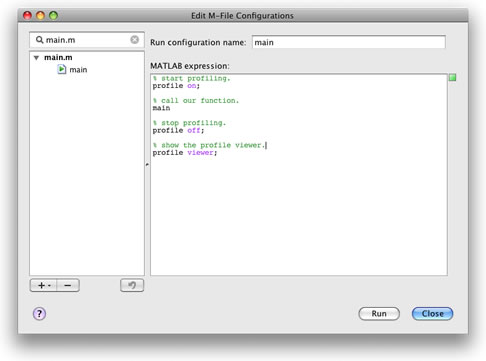
To setup a profiling run configuration, start by opening the file you’d like to improve the performance of in the MATLAB Editor. Then, open the Configuration Editor by pressing the drop-down arrow on the run button , and select Edit Run Configurations for [your file]. In the MATLAB Expression area, put the following commands, where your_function is the function to profile:
% start profiling.
profile on;
% call your function here.
your_function
% stop profiling.
profile off;
% show the profile viewer.
profile viewer;

Which should look something like this:

Close the Configuration Editor when your done.

Back in the Editor, you can click the run button (or press F5) and your code will be profiled. The Profiler will popup after running your function, so you’ll be able to immediately inspect the results, teak your code and re-run your function. To prevent the Profiler from obscuring the Editor, try docking it in the Desktop. This is a great technique for iterativley improving your code’s performance.

Check out the MATLAB documentation for more information on the profile function.

Inside the MATLAB Desktop


Next time you’re in the Boston Area

Don’t take this too personally, but I love our users. You guys work on interesting applications in every imaginable industry. By virtue of hearing what someone is doing with our products, I get to engineer vicariously on more projects than I might otherwise. Which is why I love meeting and talking to users.

As an engineer in the Boston area, I often meet a lot of scientists, engineers, or otherwise technical people. And everyone seems to have an opinion (good or bad) about MATLAB. That is a pretty awesome thing: lots of smart people with opinions that care about MATLAB.

By giving us the opportunity to learn how you use MATLAB, you help us better understand your workflows and any pains you may have using the product. This is called usability, and we enjoy having the opportunity to test, measure, and improve MATLAB. Oh, and it just so happens that we offer a nice stipend for such people to come down to our studios for an hour or two and try out the new stuff we’re working on. But the bigger reward for those who help us through testing is a better, more useful product - we apply your feedback to make MATLAB better.

If you’re interested in being part of a usability test, or would like to find more information about our user-centered design process, checkout this web page.

Hope to see you around!